
AI · 10 min read
How accurate is predictive eye tracking?
Vendors quote 89% to 96%. Nobody neutral had put the evidence in one place, so I did. Here's what those figures measure, what the independent benchmarks show, and where predicted attention breaks down on a real shelf.
In short Predictive eye tracking is good at one thing: where the eye lands in the first few seconds of free viewing. There, the best academic models are close to the limit set by how much people agree with each other. Vendor figures are self-reported and rarely say what they measure. On a shelf, shoppers search with goals, know brands and face clutter, and a picture-only model sees none of that. Use it to screen and compare early. Validate the finalists with real shoppers.

- Published
Key takeaways
- Predictive eye tracking predicts where eyes land in the first few seconds of free viewing. That's what it's tested on.
- On the independent MIT300 benchmark the best model scores 0.894 AUC. Other people predicting a held-out viewer score 0.898. A fixed blob in the centre of every image scores 0.783.
- Vendor claims run from 89% to 96%. They're self-reported, and most don't name the metric.
- Shelf evidence is thin. What exists says shopper goals, brand familiarity and clutter matter, and saliency alone misses them.
- Screen early, compare variants, test in shelf context, and validate finalists with real shoppers.
What is predictive eye tracking?
You upload an image. A model predicts where people's eyes will go and draws a heatmap. No camera, no participants, results in seconds. Vendors call it predictive eye tracking, AI eye tracking or predicted attention. Researchers call it saliency prediction.
It's built and tested on one kind of task: people looking freely at a picture for a few seconds. Keep that in mind. It explains most of what follows.
I've spent a lot of time on this question while building our own free Shelf Test and attention heatmap. Buyers keep asking me the same thing: "how accurate is it?" There wasn't a neutral answer to point them to. So here's mine, with sources.
What accuracy do predictive eye-tracking vendors claim?
Between 89% and 96%. Here's what each says, and what it's measured against, in their own words where they give them. All are vendor claims, checked on 28 October 2026.
| Vendor | Claim | Measured against |
|---|---|---|
| Neurons | "Over 95% accuracy" [1] | Eye-tracking heatmaps of 100 to 150 people viewing an image for 5 seconds. The metric isn't named. |
| Attention Insight | "Up to 96% accurate" [2] | Not stated on the home page. Its own comparison article gives 90–94.5% and says the model was evaluated on the MIT Saliency Benchmark [3]. |
| Brainsight | "94% accuracy compared to live eyetracking studies" [4] | Not detailed. Covers the pre-attentive phase, up to about 3 seconds. |
| 3M VAS | "92% accuracy" [5] | What viewers see "at first glance". |
| EyeQuant | "90%+" prediction accuracy [6] | Not described. |
| Dragonfly AI | 89% [7] | "The theoretical ceiling of human eye-tracking consensus", benchmarked on MIT's saliency datasets. |
Two things stand out. First, almost none of them name the metric. Second, the ones that say what they measured all measured the same thing: free viewing, first glance, a few seconds. None of these figures is a claim about shoppers choosing between packs.
Credit where due: some vendors are upfront about limits. Brainsight says deliberate engagement still needs live research [4]. RealEye, which sells real webcam eye tracking and AI predictions side by side, says plainly that "the prediction does not replace eye-tracking data from participants" [8].
What does "90% accurate" actually mean?
On its own, very little. Saliency researchers use several metrics, and they rank models differently. Bylinskii and colleagues at MIT wrote a whole paper on this [9].
The most common one is AUC. Roughly: take spots people looked at and spots they didn't. How often does the model rank the looked-at spots higher? 0.5 is a coin toss. 1.0 is perfect.
Here's the catch. People tend to look at the middle of an image. So a "model" that ignores the picture and puts the same blob in the centre every time already scores well. On the MIT300 benchmark that centre blob scores 0.783 AUC. On CAT2000 it scores 0.845 [10][11].
I'm not saying any vendor's figure is an AUC. They mostly don't say what it is. That's the point. A percentage without a metric, a dataset and a baseline can't be compared, and a high-sounding one can be mostly centre bias.
Ask any vendor three questions: which metric, on which images, and what does a centre-bias baseline score on the same test?
How good are the best models on independent benchmarks?
Very good, at the task they're tested on. The MIT/Tuebingen Saliency Benchmark is the closest thing to a neutral scoreboard. Models are scored on held-out eye-tracking data they've never seen.
- MIT300: 300 indoor and outdoor scenes, 39 observers, 3 seconds of free viewing [12].
- CAT2000: 4,000 images from 20 categories, 24 observers per image, 5 seconds of free viewing [12].
| On MIT300 (AUC) | Score | What it is |
|---|---|---|
| Centre bias | 0.783 | The same blob for every image. The floor. |
| DeepGaze IIE | 0.883 | A leading academic model (2021). |
| DeepGaze MSDB | 0.894 | Top of the AUC table when checked (2025). |
| Other people | 0.898 | Everyone else's fixations predicting one held-out viewer. The benchmark calls this a lower bound on what's explainable. |
Scores from the MIT300 leaderboard [10]. On CAT2000 the same top model scores 0.885 against the centre-bias 0.845 [11].
So the honest summary is this. For free viewing, the best models predict where a person will look about as well as a crowd of other people does. That's a real achievement. But the step up from "blob in the middle" to "best model in the world" is 0.78 to 0.89. Much of what a heatmap shows you is the centre bias plus the obvious high-contrast bits.
Note too that these are research models on research images. Commercial tools rarely appear on the public leaderboard under their own names, so you can't read their scores from it.
Has anyone tested predictive attention on packs and shelves?
Not much, and not recently. I looked for a recent, independent, peer-reviewed study comparing commercial predictive tools with eye tracking on packs on shelf. I didn't find one. If you know of one, please send it to me.
What I did find:
- PRS, 2014. Perception Research Services ran 20 images (10 shelves, 10 packs) through 3M VAS and compared them with eye tracking of 150 in-person shoppers. VAS results clustered around 50%, with little difference between pack elements. Comparing a control and a test pack, VAS predicted no differences; eye tracking found significant differences on all five main design elements [13]. Two caveats: PRS sells eye tracking, and this is a 2014 version of the software.
- van der Lans, Pieters and Wedel, 2008. An eye-tracking study of brand search at the shelf, in Marketing Science. It split shelf salience into bottom-up (in-store activity and package design) and top-down (out-of-store marketing such as advertising). Roughly two-thirds was bottom-up, roughly a third top-down [14]. A picture-only model can only see the first part.
- Gidlöf, Anikin, Lingonblad and Wallin, 2017. Mobile eye trackers on shoppers in real supermarkets, in Appetite. Looking longer or more often at a pack made it more likely to be bought. But the authors conclude visual attention "cannot be captured by measurements of visual saliency alone", because shoppers bring preferences, price sensitivity and diet goals [15].
So the shelf evidence points one way. Saliency explains a real part of what shoppers look at, especially at first glance. It doesn't explain all of it, and it says nothing about what they pick up.
Where does predicted attention break down on a shelf?
- Free viewing versus a shopping task. Benchmarks ask people to look freely for 3 to 5 seconds. Shoppers are searching. Tatler and colleagues reviewed gaze in natural tasks and found salience models can "fail dramatically" there [16].
- Top-down goals. A shopper looking for a flavour, a price or a "no sugar" claim looks for it. The model doesn't know what they want.
- Brand familiarity. Regular buyers find their brand by shape and colour they already know. That's the top-down third in van der Lans' study [14]. Advertising and habit don't show up in pixels.
- Shelf clutter. Most benchmark images are scenes and photos. A shelf is dozens of packs all designed to stand out. Small contrast differences decide a lot, and that's where PRS found the predictions flattened out [13].
- The first 3 to 5 seconds only. The models predict the opening glances. 3M says "first glance" [5], Brainsight says up to about 3 seconds [4], and benchmark viewing lasts 3 to 5 seconds [12]. Reading the back of pack, comparing prices and choosing come later.
- Words. Text pulls the eye, and models can pick that up. They can tell you a claim gets looked at, not whether it's read or understood.
Are synthetic shoppers and synthetic respondents accurate?
This is the next layer of the same debate. Two different things get called "synthetic" in research, and it helps to separate them.
Synthetic respondents are AI models answering survey questions as if they were customers. The numbers so far:
- Bain (May 2026): digital twins built from historical respondent data reproduced "about 90% of key outcomes" of a prior large conjoint study for one consumer technology client [17]. Bain's own caveats: one case, the scoring isn't described, and it recommends augmenting real research, not replacing it.
- BCG (May 2026): in a conjoint test for a new beverage, synthetic panels predicted real consumer choices at 92% accuracy [18]. BCG also says they "can't replace traditional market research", are weaker for radically new products, and should be checked with paired studies against human panels.
- Stanford and Google DeepMind (Park et al., 2024): agents built from interviews with 1,052 people replicated their answers on the General Social Survey 85% as accurately as the people replicated their own answers two weeks later [19]. That's a relative figure, not 85% of all behaviour.
- The critics (Bisbee et al., 2024, Political Analysis): ChatGPT respondents looked like real ones on averages, but showed less variation and led to different conclusions in regressions [20]. They used an older model, but the warning stands: averages can match while the spread is wrong.
Synthetic shoppers, the way we use the term, are different. They don't answer questions. In our Shelf Test, each of 1,000 simulated shoppers makes a look about every quarter second, led by predicted attention, from their own eye height and with their own glance time. So their accuracy can't be better than the attention model underneath. The 1,000 runs make the result precise, about ±3 points. Precise is not the same as accurate.
The common thread across Bain, BCG and the critics: good for speed and early direction, check against real people before big calls.
How do you use predictive attention well?
- Screen early. Use it when you have ten ideas and no budget. Cut ten to two. Catch the claim that sits in a cold spot before it goes to print.
- Compare variants, don't trust absolute scores. "Version B gets more attention on the claim than version A" is a sound use. "The claim gets 4.5%" is a model output, not a fact about shoppers.
- Test in context. A pack on a white background is a different picture from a pack on a shelf next to its competitors. Test the shelf.
- Mark what matters. Draw boxes on the brand, the claim and the flavour, and look at the share each gets. A pretty heatmap on its own is easy to over-read.
- Ask about the metric. Which one, on which images, against which baseline. If a vendor can't answer, treat the percentage as marketing.
- Validate the finalists with real shoppers. A virtual shelf with a panel, or eye tracking in a lab. Especially when the pack relies on brand recognition or words, or the decision is expensive to reverse.
For a side-by-side of the tools, including the human-panel shelf tests, see Shelf test and predictive attention tools compared.
Where does our Shelf Test fit?
At the screening end, and I'd rather say that plainly than oversell it.
Our attention engine blends four published saliency methods (spectral residual, centre-surround contrast, a text prior and frequency-tuned saliency) with a centre bias. It's a bottom-up model. It doesn't know brand familiarity, the shopper's task or what they're looking for. It has not been validated in an eye-tracking study of our own. All of that is on the attention heatmap page, with references.
What it does well: it's free, it puts your pack on a shelf against competitors, it adds shopper materials one at a time, and it walks shoppers down the aisle. Use it to narrow ten ideas to two. Then put the two in front of real shoppers.
Consulting
Planning a pack or shelf test?
I spent years at Coca-Cola as head of digital strategy. If you're choosing between predictive tools, synthetic research and real shopper studies, or want your real products on your real shelves, let's work out the right mix for your decision.
Sources
All accessed 28 October 2026. Vendor figures are the vendors' own claims.
- Neurons, Neurons attention prediction: validation and accuracy.
- Attention Insight, home page.
- Attention Insight, Predicted eye-tracking tool comparison: 3M VAS vs Attention Insight.
- Brainsight, pricing and FAQ.
- 3M, Visual Attention Software.
- EyeQuant, about.
- Dragonfly AI, our science.
- RealEye, Shelf report: predicted attention.
- Bylinskii, Z., Judd, T., Oliva, A., Torralba, A. & Durand, F. (2019). What do different evaluation metrics tell us about saliency models? IEEE Transactions on Pattern Analysis and Machine Intelligence, 41(3). doi:10.1109/TPAMI.2018.2815601
- MIT/Tuebingen Saliency Benchmark, MIT300 leaderboard.
- MIT/Tuebingen Saliency Benchmark, CAT2000 leaderboard.
- MIT/Tuebingen Saliency Benchmark, datasets (Judd, Durand & Torralba, 2012; Borji & Itti, 2015).
- Asher, J. (2014). Comparing eye-tracking to 2 cheaper challengers. Quirk's.
- van der Lans, R., Pieters, R. & Wedel, M. (2008). Competitive brand salience. Marketing Science, 27(5), 922–931. doi:10.1287/mksc.1070.0327
- Gidlöf, K., Anikin, A., Lingonblad, M. & Wallin, A. (2017). Looking is buying. How visual attention and choice are affected by consumer preferences and properties of the supermarket shelf. Appetite, 116, 29–38. ScienceDirect
- Tatler, B. W., Hayhoe, M. M., Land, M. F. & Ballard, D. H. (2011). Eye guidance in natural vision: reinterpreting salience. Journal of Vision, 11(5):5. doi:10.1167/11.5.5
- Bain & Company (4 May 2026). Synthetic customers earn their stripes.
- Boston Consulting Group (29 May 2026). Want consumer insights faster? AI can help.
- Park, J. S. et al. (2024). Generative agent simulations of 1,000 people. arXiv:2411.10109.
- Bisbee, J. et al. (2024). Synthetic replacements for human survey data? The perils of large language models. Political Analysis.
About the author
Kenneth Phua
Founder, Konverta.ai
Kenneth is a Singapore-based digital, data and AI leader with 15+ years of experience, including senior global roles at Coca-Cola, where he was the Global Head of Digital Strategy and Innovation. He has advised C-suite leaders across FMCG, retail, property, hospitality and luxury, and now applies the same playbook to Singaporean and Asian corporates and SMEs through Konverta.ai.
The newsletter
Weekly insights in digital, data and AI.
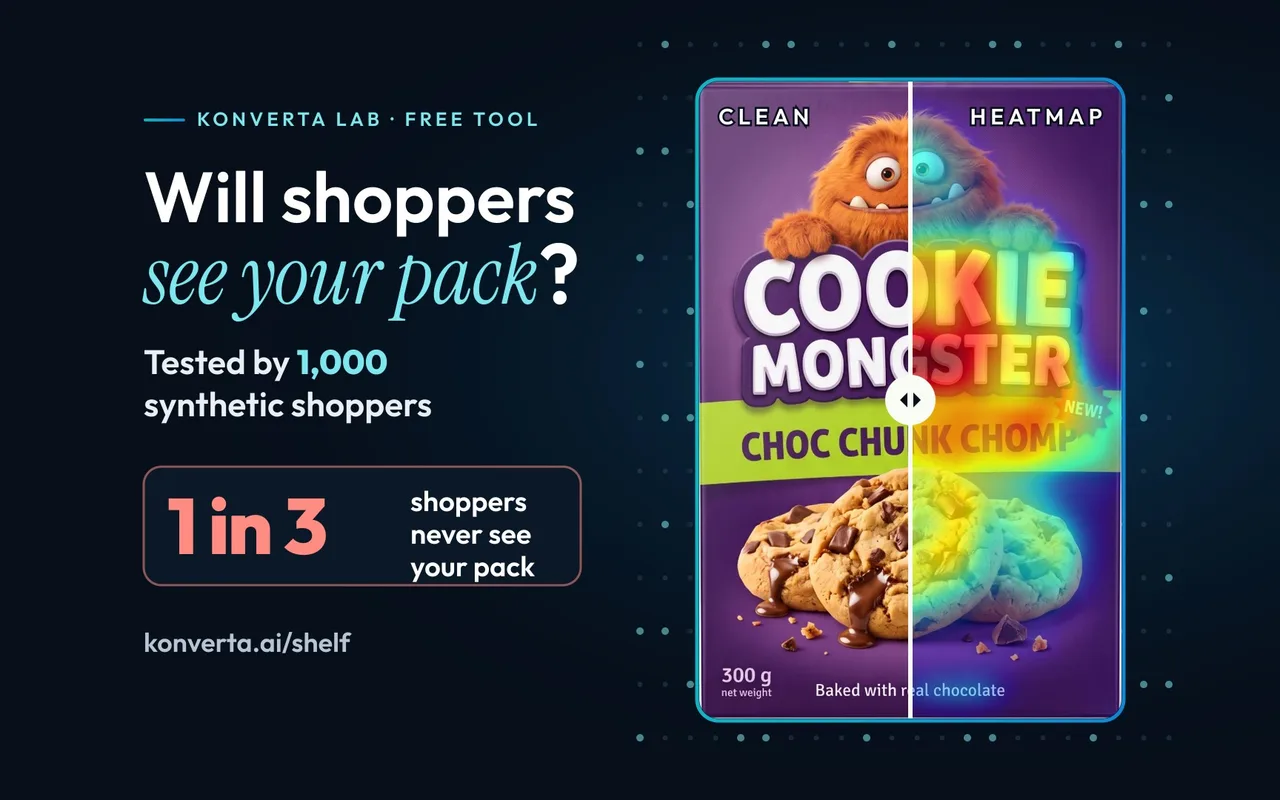
Can 1,000 synthetic shoppers tell you if your pack grabs attention in store?
The Shelf Test: 1,000 synthetic shoppers to test if your pack grabs the right attention in store, free to try.
Next steps
Konverta Lab
Screen your pack before you spend on fieldwork.
The free Shelf Test runs 1,000 synthetic shoppers past your pack, your shelf and the aisle. Or see how the tools compare.
Prefer a form? Contact us.